Waterfall charts are a great way to visualize how different parts of a whole contribute to the total. They can be used to show how a goal is broken down into smaller pieces, how progress is being made towards that goal, or how different factors contribute to a final result. Keep reading to learn when to use waterfall charts and how to create them in Excel.
How Waterfall Charts are Used
Waterfall charts are a great way to visualize how a particular value changes over time. These useful charts can be used to track revenue, expenses, or any other type of data.
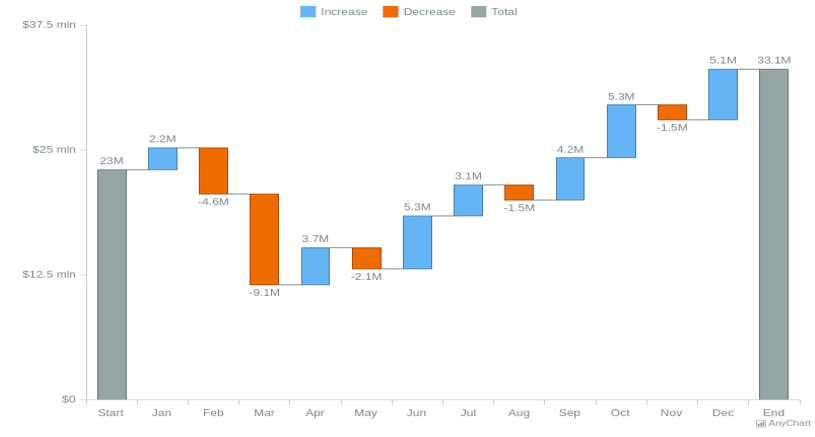
There are three main components to a waterfall chart: the starting point, the change in value, and the ending point. Waterfall charts should be used when you need to show how values change over time, and you want to emphasize the difference between the starting point and the ending point.
Waterfall charts can be used to compare values in any order you like. However, most people use them to compare values in descending order so that the largest values are at the top and the smallest values are at the bottom. This makes it easy to see which values had the biggest impact on overall change.
How to Create a Waterfall Chart
To create a waterfall chart in Excel, you will need two columns of data: the first column will contain the initial value, and the second column will contain the change in value. In cell A1, type “Value 1,” and in cell B1, type “Change 1”. Copy cells A1 and B1 down through row 10.
In cell A11, type “Value 2,” and in cell B11, type “Change 2”. Copy cells A11 and B11 down through row 20. Now it’s time to create your waterfall chart. Select cells A2:A10 and click on Insert > Chart > Line Chart.
Excel will create a basic line chart based on the data in those cells. Right-click on any of the lines in the chart and select “Add Data Labels” from the menu that appears. This will add labels to each line indicating its value at each point along the graph axis. Next, you’ll need to format your waterfall chart so that it looks like a waterfall chart instead of a line chart. To do this, you’ll use some custom formatting rules for your data series (the lines in our waterfall chart).
Select all of the lines in your waterfall chart (by clicking once anywhere inside of them) and then press Ctrl+1 (or go to Format > Series > Options). In this dialog box, set Border Width to “0pt,” Cap Style to “Butt Cap,” Join Style to “Miter Joint,” Marker Type to “None,” and Marker Size to “0pt.”
The first column in a waterfall chart is always at the bottom and is usually called the “base” or “initial” value. The second column is often called the “change” column, and it shows how much each value changed from the base value. Finally, the third column is usually called the “percentage change” column, and it shows how much each value changed as a percentage of the base value.
The chart begins with a value of 0 and then sequentially adds or subtracts values, tracking the cumulative result.
Situations in Which Waterfall Charts Are Used
Waterfall charts are typically used when you want to show how a particular value changes by comparing it to other values. In a waterfall chart, each column represents a different value, and the height of each column represents the relative size of that value.
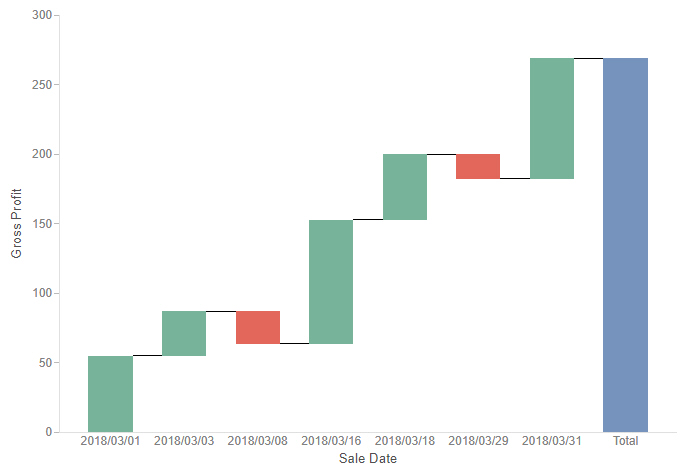
Waterfall visualization can be used to illustrate how individual items contribute to a total, such as monthly sales totals or budgeted expenses. They can also be used to track changes in a value over time, such as stock prices or company profits.
In a nutshell, waterfall charts are an important tool for visualizing data and understanding how different parts of a process contribute to the overall outcome. They can be used to track progress over time, identify areas of improvement, and make decisions about where to focus resources. When used together with other data visualizations, waterfall charts can help you understand the big picture and make better decisions.